
Practical Uses of Vena Copilot for FP&A Teams
AI has become an everyday part of our vocabulary now, to the extent that it is routinely used to suggest that we can use it for almost any situation. While the jury may be still out on that particular broad-brush assertion, it is definitely gaining significant traction for FP&A Finance Teams.
Finance automation has for some time been at the heart of every Finance Directors to-do list, and now, with the introduction of the likes of Vena Copilot Agentic AI, automation and reporting functionality has become a reality that is in widespread use.
In this article, we take a look at some practical uses of Vena Copilot to see how it is utilising the Microsoft ecosystem (with a particular emphasis on its use within Teams) to transform finance operations and management, and see what’s in store in the very near future.
How Vena Copilot Works for FP&A Teams
Vena Copilot in Use
Reporting with Vena Copilot
Vena Copilot for Strategic Analysis
Conclusion
How Vena Copilot Works for FP&A Teams
Vena Copilot can be accessed either through your Vena Solutions login and optionally, can also be accessed in Microsoft Teams. Both entrances have to have access to the Copilot role. Additionally, it's also governed by your Vena security profile, so if somebody only has access to a single entity or even a single product, they'd only be able to ask questions about that specific data point.
Vena have pre-trained the Agentic AI models with thousands of different FP&A questions and there's actually a question bank with curated prompts that you can use. And so, you can have some ready-to-go prompts, or you can type in your own questions on the fly.
Vena Copilot in Use
To set the scene, let's say we're having a meeting to perform a May reforecast of our company, which is a fairly typical business or financial activity, and that we manufacture electric bikes.
You are probably going to be looking at some data points to understand data trends and start to develop strategies for where you need to reallocate resources to ensure you're course-correcting the business in order to meet targets. So, in the following example, going into the meeting, senior leadership only has access to a handful of reports.
Now before we begin updating the May reforecast, the leadership team may ask to see the breakdown of April revenue by product, including your top and bottom performers. So instead of finding and refreshing those reports manually, we can ask that question live, in Copilot.
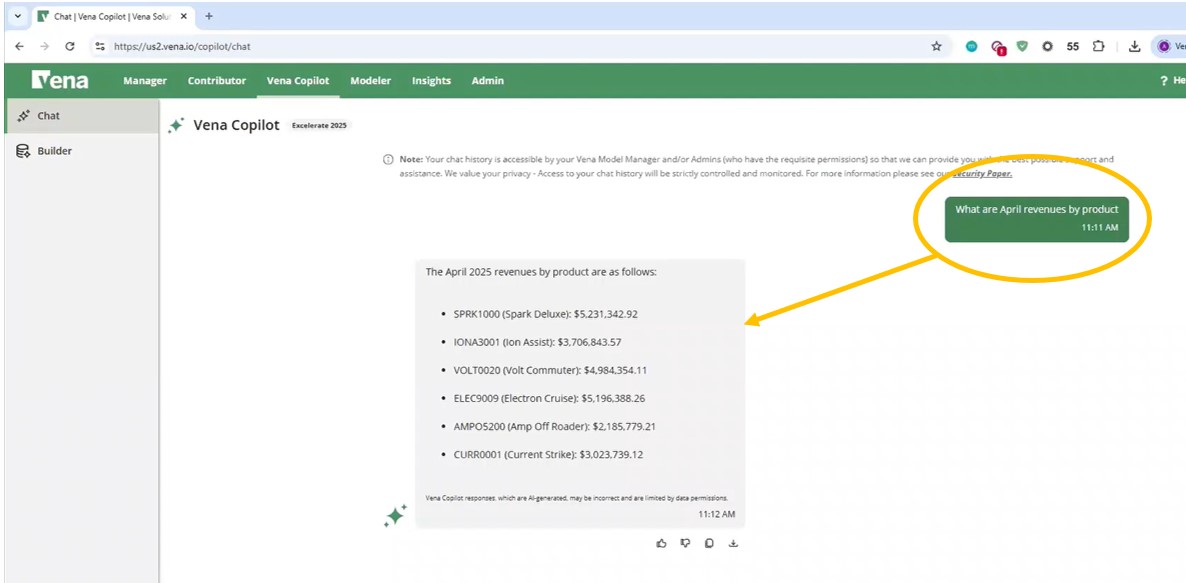
You simply type your question in natural language – ‘what are my April revenues by product?’ and then the large language model (the AI model) that is sitting on top of your data is going to be able to understand your question, but importantly, also your metadata - your chart of accounts, your products, your customers.
From this query, Vena Copilot is going to be able to understand your natural language, relate it back to your data and then pull out an answer. Below, you can see it's come back with the April revenues by product.
But now you may well have some follow up questions.
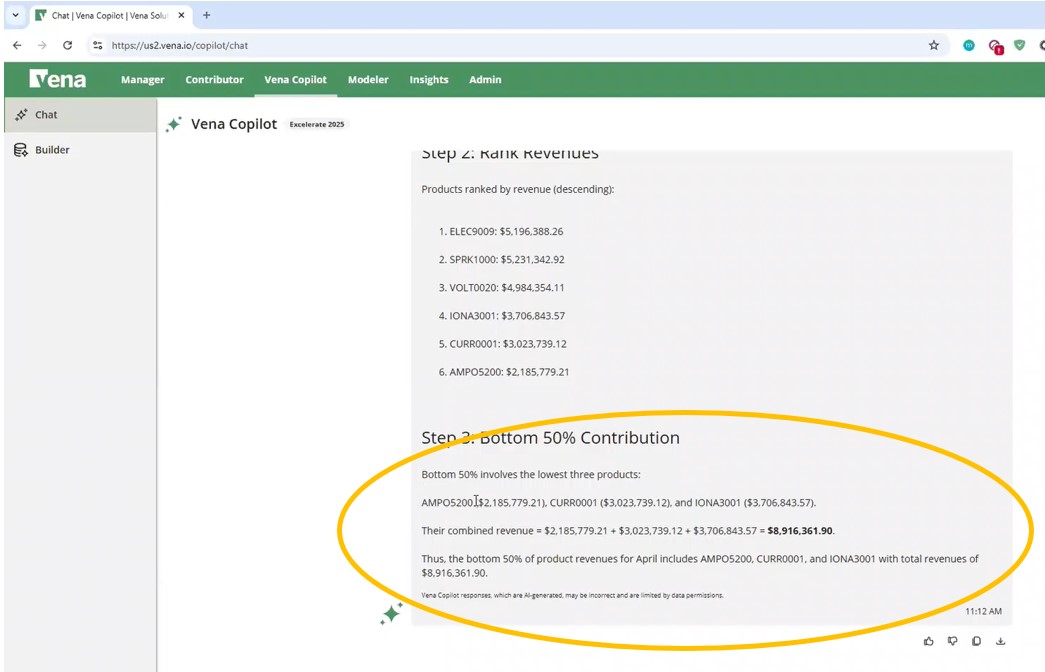
Just type-in those questions – for example, ‘what are my bottom 50% of product revenues for April and show the calculations’. We can tell Copilot to be brief, answer in 20 words, bring it out in a list format etc. All the things that you can do with a ChatGPT or Gemini type tool, can be done in Vena Copilot.
You will now be presented with that answer, together with all of the additional context around the calculations. Below, you can see it's identified the bottom or the lowest three products. This shows that the AMP Off-Roader is the bottom performer.
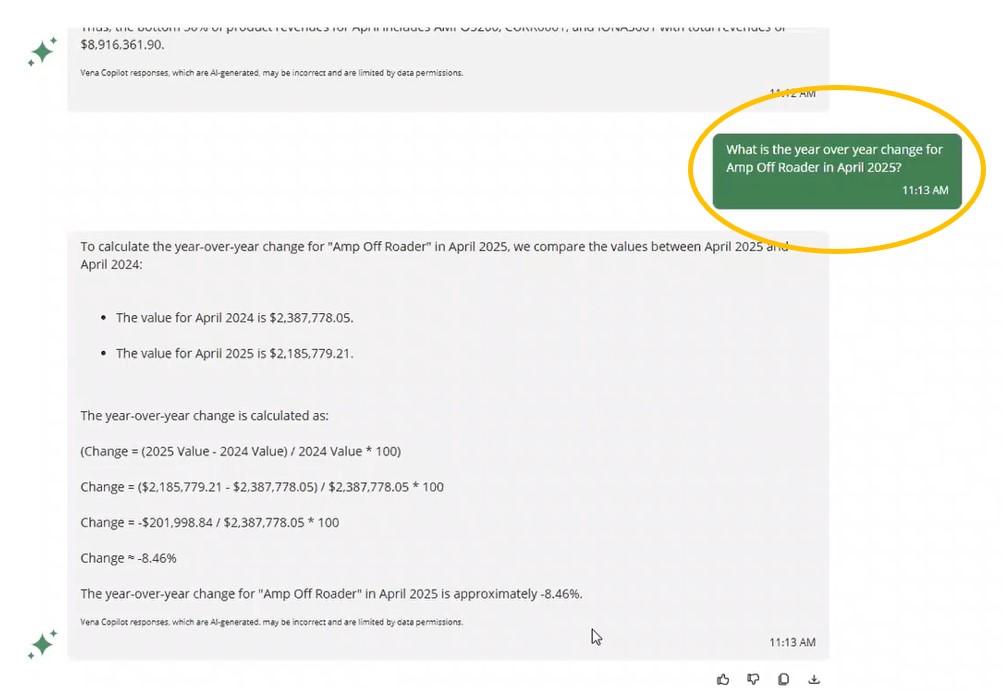
Armed with that information, you can focus further on this particular product and might want to ask Copilot ‘how did it do compared to last year?’ So now type in ‘what is the year over year change for that product in April 2025?’
This example could see the Finance Team or the Sales Operations Team asking these questions, or you can give access to your end users. This means that instead of someone having to provide answers manually, Copilot can manage all of those transactional queries. And of course, that means you're freeing up time for more strategic work.
Reporting with Vena Copilot
Below, now we can now see the prior year revenue, the current year revenue, the total difference, and we can see that year over year change as a percentage.
This shows a significant drop in AMP Off-Roader sales, this particular E-bike. Now you would probably want to build a report to get more details on that breakdown. Typically, what would happen now is someone on the team would go off, they'd get the data out and they'd shape a report manually. But because you’re using Vena Copilot, utilising the new Reporting Agent, you can ask it to do just that – ‘create a report for April revenue by product and by customer’.
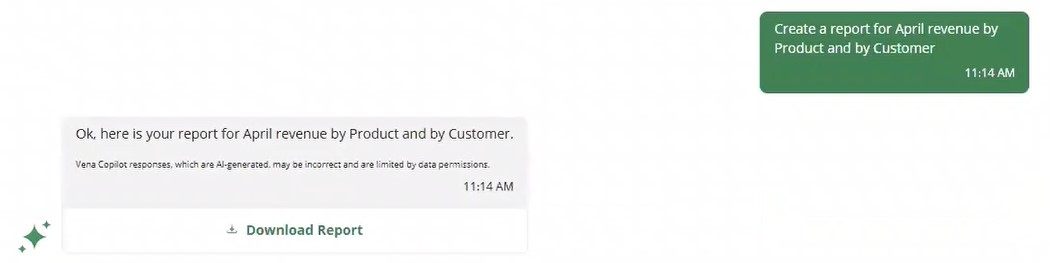
This uses the same user interface, but now you can see those agentic capabilities mentioned earlier in action. In this case, you're guiding it to actually provide a downloadable report and that will open-up in Vena.
You will now have a Revenue Report straight away for April, by customer and by product and you can further modify this report using Vena's ad hoc reporting feature to also provide feedback to Copilot in order to improve the future results.
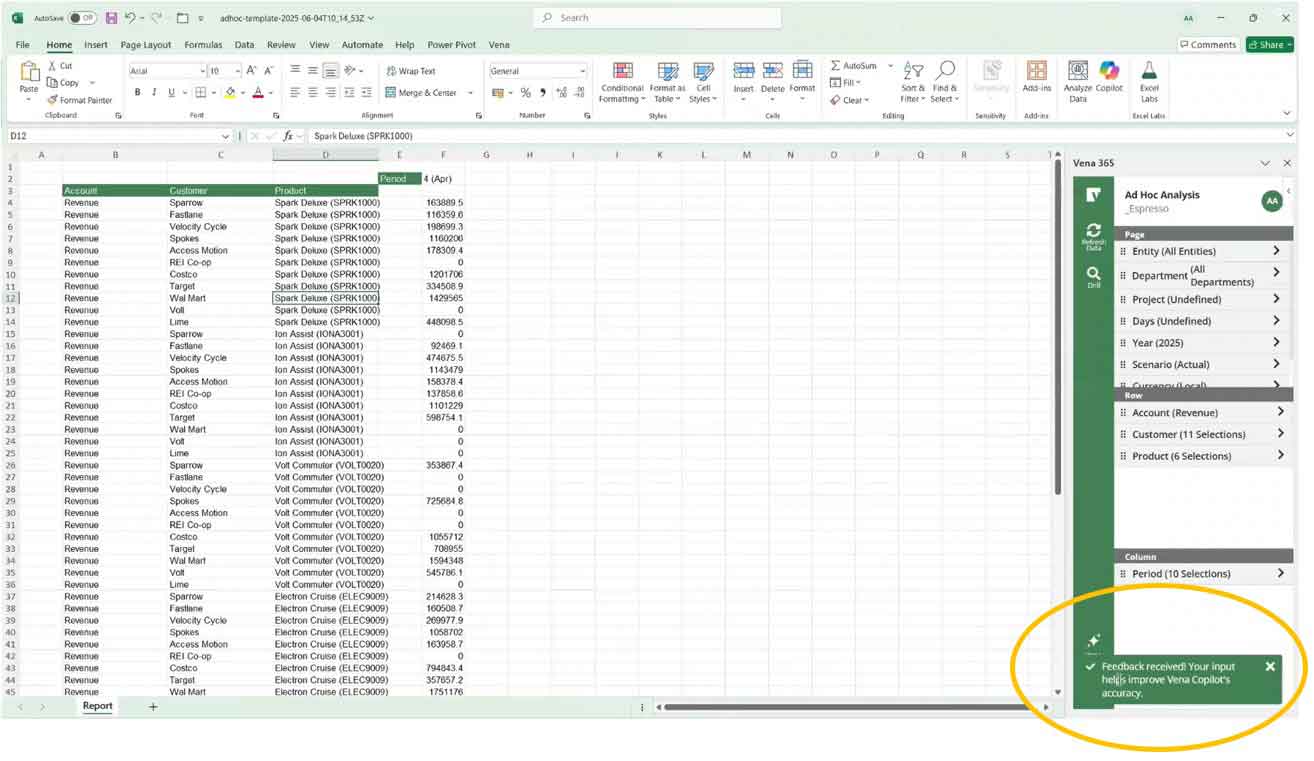
Unless you have specified otherwise, the report will default to the current year (2025) and you can see in the above screenshot that you're looking at Actuals, which is great, but now you can do a little bit of a cleanup on this report.
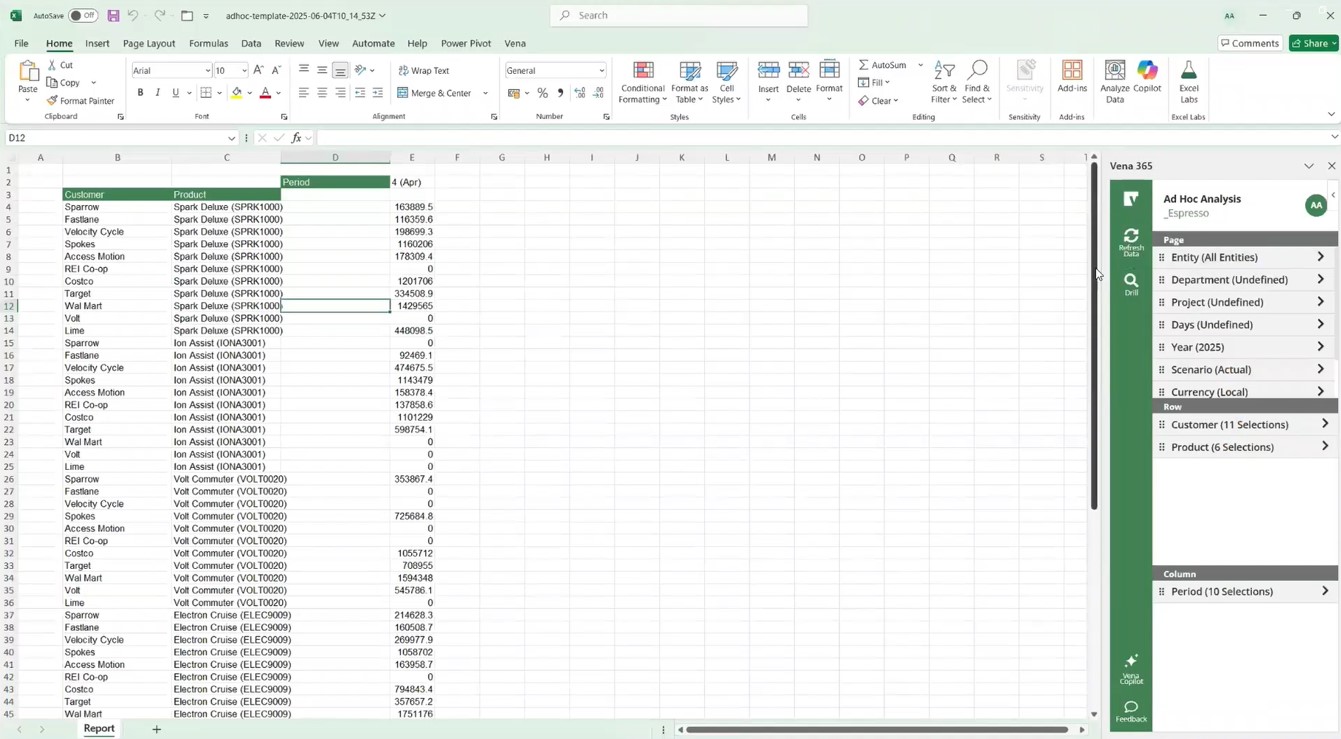
In the rows, you're currently looking at one specific or one revenue account here. If you now drag revenue to the pages or the filters and then click on any dimension, you can start to browse the hierarchy.
You will now be presented with all of your revenue accounts. You may have some subcategories there and may wish to select ‘account 4000’ which is the product revenue. You can then filter on one specific account and then also change the department selection to ‘non-specified department’. You will now see all of your revenue data that is not department-specific and clicking ‘refresh’ will present all of that updated information on the report (below).
You will now have a great ‘starter report’, but maybe it's generated some additional questions. Maybe you're curious as to if there are any common trends in that AMP Off-Roader product. So of course, you can go back to Copilot and ask those questions, but you can also modify the report in a very flexible and efficient manner.
For example, you know that you want to focus on the AMP Off-Roader product. By moving the product into the pages, you'll see that it automatically becomes a filter. You will then be able to able to filter on that specific product in question and also do the same for entities. You will want it to be a filter that you’re able to select.

The above screenshot shows that it's automatically been created there, and you could then select (for example) the US entity. Now if you want to start to look at trends coming into this scenario, you may wish to change that to the plan because now you're starting to look into the future.
For this period, you can select the bottom level of full year. Selecting all the months in the year (and of course for the plan, you already have your month to date numbers that have been actualised), and as you slice-and-dice, it will update that report with your changes on the fly.
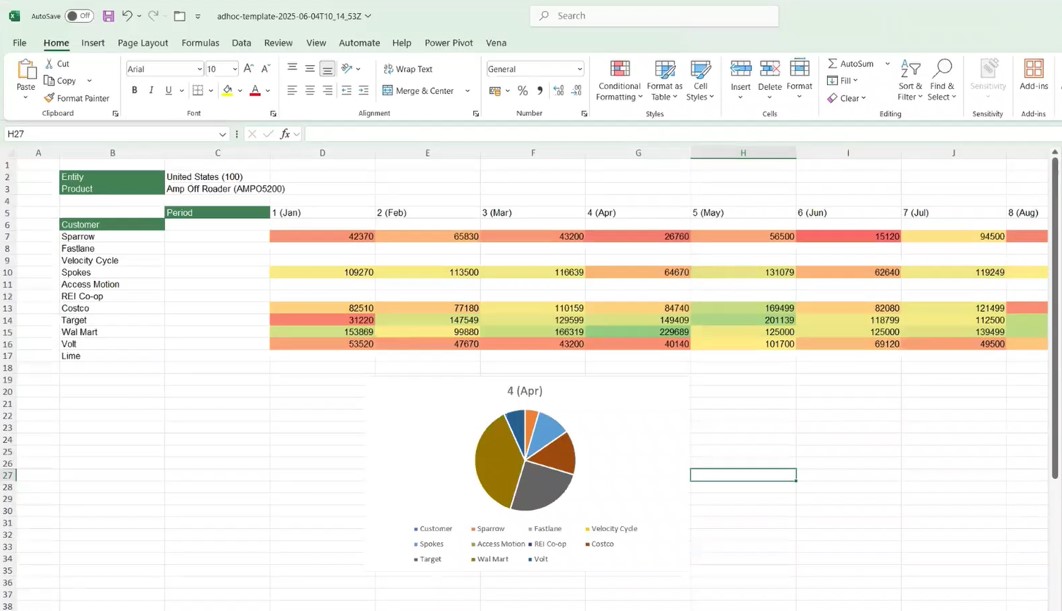
Next, click refresh and you'll see all that data is being pulled through. At this stage, you can do some standard formatting. This is just like Excel, so you might change the number format, include or insert a chart, etc., and now visually you can start to see meaningful insights into your top customers.
You can also add some conditional formatting here because again, you will want to identify the trends in your data and easily identify where you're performing off-trend. In the image below, you can see that you're trending off of your target and will need to make sure that you increase product sales for this specific product, which is our AMP Off-Roader, by at least 10% to hit target.
Vena Copilot for Strategic Analysis
Next, you might be asking, ‘what are some strategies that we can deploy?’ So, go back into Copilot and ask for some actions that can be taken to improve May to December revenue for that product based on the April performance. You’re now using Copilot to generate reports to interrogate the data in a meaningful way, but you can now also use it to drive strategic decisions and improve the overall health of the business.
For example, maybe now you've decided on reallocating some advertising spend from an overperforming product to this underperforming product. And from there you can even start to do what-if modelling. For example, ‘how would a 10% increase in May to December revenue for this product contribute to my gross margin in 2025?’
Again, from here what you would do in practice is, based on all this intelligent insight, you're now better equipped to update your May forecast in Vena for this particular product. And if you remember at the beginning of this article, the scenario we wanted, was to update the May reforecast, but to do some analysis beforehand.
In this scenario, you'd now go back into Vena and update the reforecast, then refresh this ad-hoc report and see the results of all those changes immediately. Of course, you can also still drill-down on any of the data in the ad-hoc report. You can also do an audit on a particular cell so you can see where that number is coming from, when it was last saved and by whom.
And finally, if you need to prepare for a board meeting, you can ask Copilot to help you prepare for that. For example, ’what are some tricky questions the board may ask about Q1 revenue performance?’ It’s worth reiterating at this point that this is all available in Microsoft Teams, so not only can you interact with Copilot and generate reports, but you can also collaborate on reports and analyses as well, directly within Microsoft Teams.
Conclusion
To summarise; everything you've read above is what's available today in Vena. Currently, Vena Copilot provides an Analytics Agent and a Reporting Agent. Coming later on this year (2025) is a Planning Agent that will allow you to do driver based forecasting using Copilot in Excel. The drivers can of course be internal data, but it can also be using external factors like changes to National Insurance or inflation for example.
For now, your data will always stay within your environment, but later Copilot will be able to read external data sets and bring that in as well, so you can run calculations and reforecast. Further on down the line, Vena are expecting to introduce a Visualisations Agent, where Copilot will be able to create dashboards and interactive visuals. So, with lots of interesting things to come. This is just the beginning. Stay tuned!
Recent


